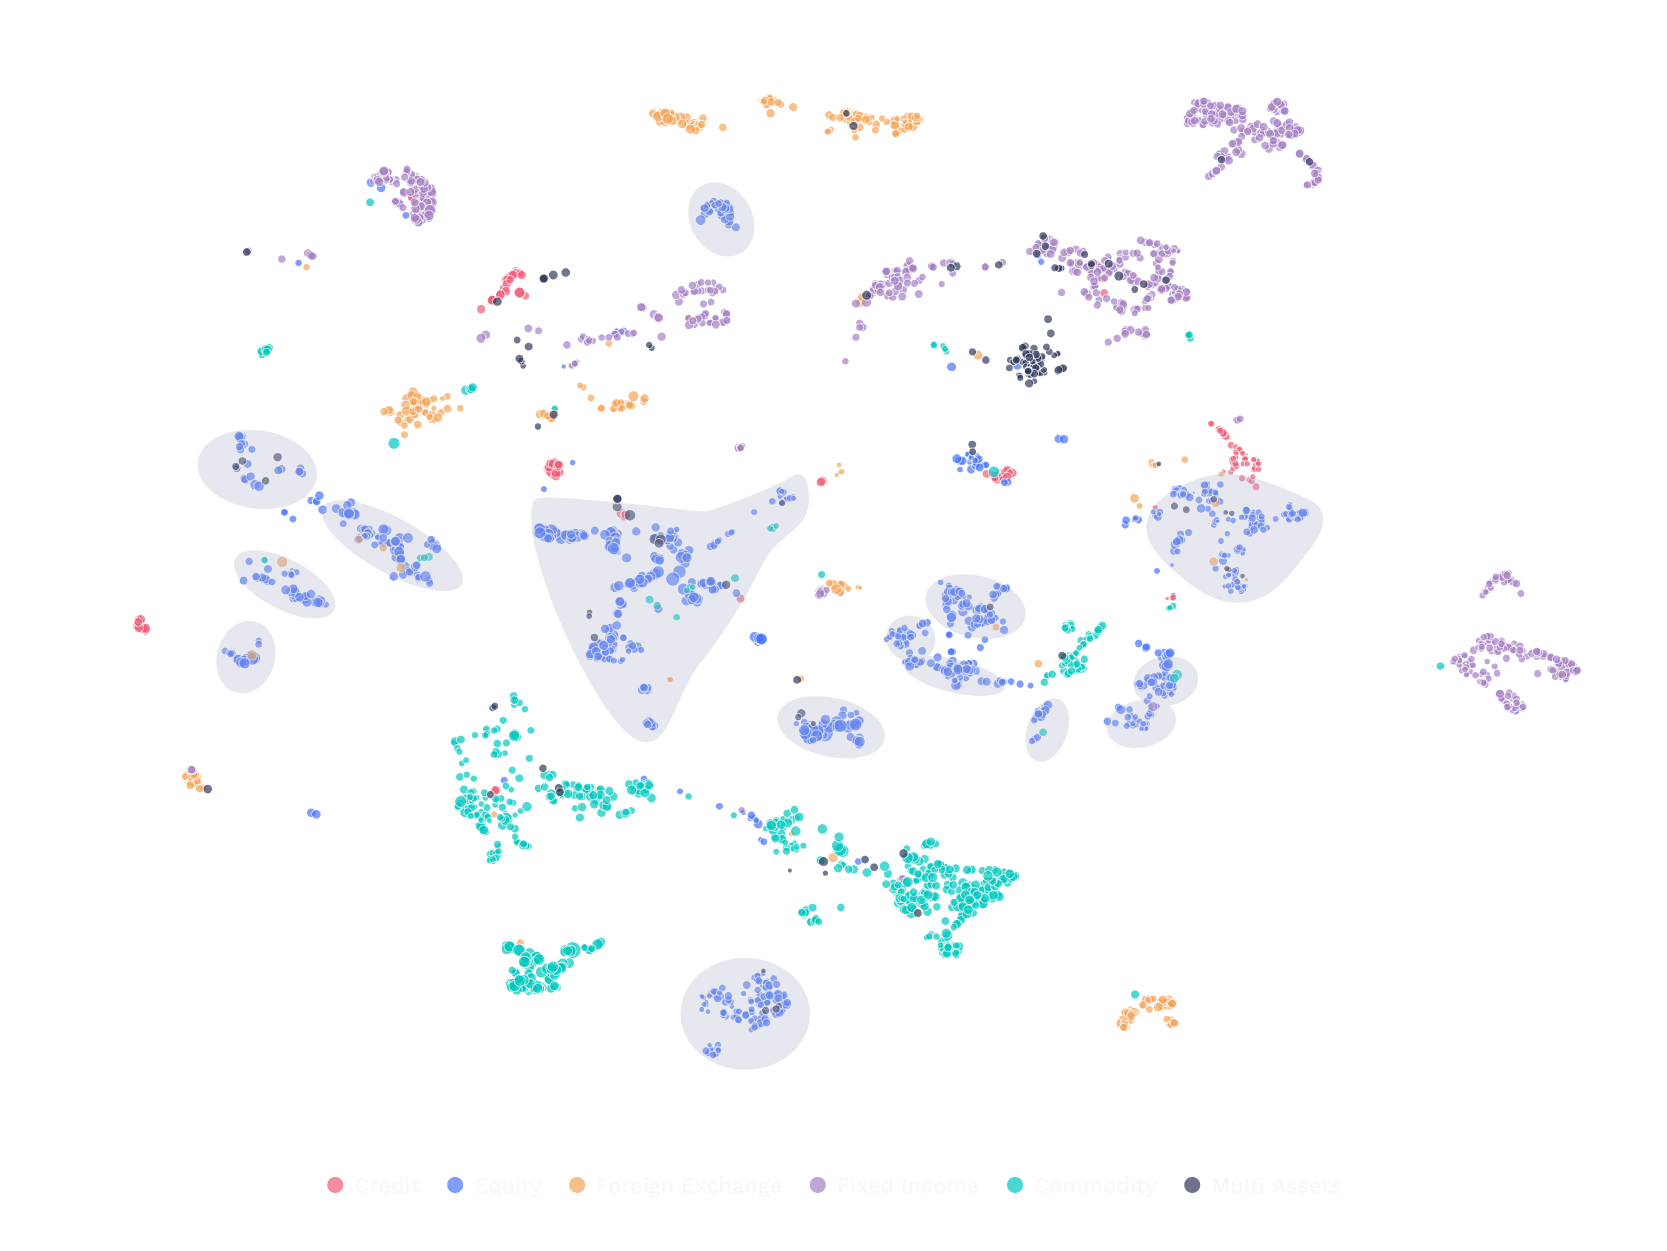
With the advancement of Quant investing, accessing high quality, clean data, and the ability to effectively interpret it have become increasingly important. Proficient data visualization, in particular, plays a crucial role in streamlining complex information and driving accurate investment decision making.
Premialab provides a unique set of data derived from its partnerships with the top 18 global investment banks, granting clients access to over 5,000 single and multi-asset Quantitative Investment Strategies (QIS). Through the provision of this comprehensive QIS database and cutting-edge visualization tools, Premialab empowers both multi-asset and quant investors to take the lead in multi-asset allocation and risk analysis.
This article presents a data visualization model that offers a unique perspective on clustering based on common risk factor classifications, allowing the QIS universe to be represented in a two-dimensional scatter plot. With similar strategies grouped together, this methodology proves valuable for investors, facilitating various tasks such as the creation of peer groups and portfolio construction.
Download the full article now to discover how to leverage this powerful visualization model for enhanced analysis and investment decision-making.


